
China Electrical Steel Production Analysis: High-End Breakthrough & Profit Restructuring
China electrical steel industry output hit 8.7472 million tons in H1 2025, up 12.1% year on year. However, the interesting number is not the total. It is the split inside it. Premium tonnage rose fast, commodity tonnage stalled, and margins diverged by grade. Jiangsu Zhongtong Weiye Special Steel Co., Ltd. buys and slits this material in Wuxi daily, so here is how the restructuring actually reads.
Layer 1 — Volume Rose, but the Mix Decided Everything
Grain-oriented output reached 1.5811 million tons, a gain of 17.30%. Non-oriented output reached 7.1661 million tons, up 10.52%. Consequently, oriented steel grew roughly twice as fast as non-oriented steel.
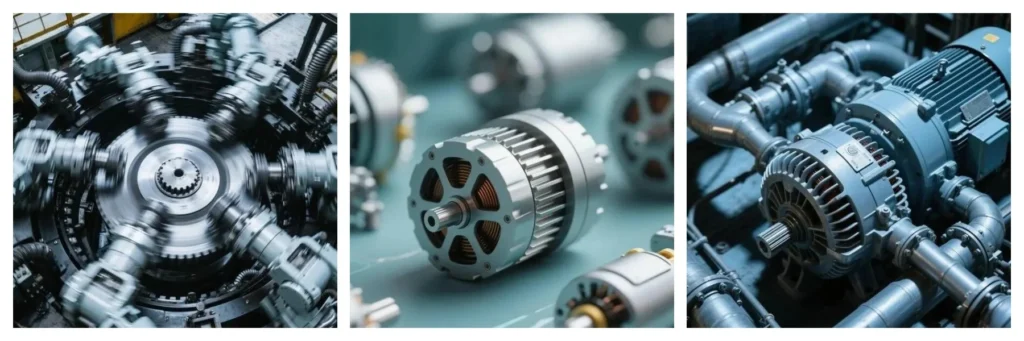
That gap matters. Oriented sheet serves static cores, where efficiency rules bite hardest. Therefore, policy pressure converted directly into tonnage. Non-oriented sheet serves rotating machines, where demand tracks industrial output instead.
Layer 2 — Hi-B Broke Through Two-Thirds
Hi-B oriented steel hit 1.0661 million tons, or 67.43% of oriented output, up 15.91%. Conventional oriented steel also grew, reaching 515,000 tons at plus 20.29%.
That simultaneous growth looks contradictory, yet it had a simple cause. Total demand expanded fast enough to lift both tiers. Subsequently, substitution caught up. By H1 2026, CGO output fell 20.14% to 411,300 tons, while Hi-B climbed to 76.77% of the market.
Non-oriented followed the same curve more slowly. High-grade NGO reached 2.45 million tons, up 24.11%, and EV motor steel alone hit 665,300 tons, up 26.50%. Meanwhile, mid and low grades grew only 4.57%.
Layer 3 — Margin: Who Actually Earned Money
Conventional oriented steel earned very little. Ample supply met homogenised competition, so prices sat near cost and profits ran marginal. In contrast, Hi-B held a premium because high-end demand stayed rigid.
Non-oriented split in a different way. Mid and low grades faced shrinking downstream orders and open price wars. As a result, many producers ran near break-even or below it. High-grade and EV-specific grades kept demand growth, yet new supply capped price gains.
Therefore, the profit map looked like this:
- Hi-B oriented: stable margin, allocation-driven.
- Conventional oriented: thin margin, shrinking share.
- High-grade non-oriented: decent demand, crowded supply.
- Mid and low non-oriented: near zero margin, structural surplus.
Layer 4 — Trade: Selling Premium, Buying Commodity
Exports rose 9.81% to 765,900 tons. Oriented exports led at 393,200 tons, up 24.77%, while non-oriented exports slipped 2.52%.
Average export price reached RMB 9,953 per ton, up 1.39%. Average import price fell 12.68% to RMB 7,939 per ton. That inversion is the clearest proof of upgrading. China now ships high-grade sheet out and takes commodity sheet in.
Three markets drove the export gain. North American transformer rules under DOE-2029 lifted GOES purchases. India combined grid expansion with BIS certification. Middle East data centre spend sustained transmission demand.
Layer 5 — What Arrives by 2027
Twenty-seven projects sit in the pipeline. Fifteen cover oriented steel with 1.67 Mt of annual capacity, and twelve cover non-oriented steel with 5.01 Mt. East China hosts thirteen, Central China eight, North China five, and South China one.
Ramp-up needs 18–30 months, so the supply shock lands later than the announcement. Of course, that lag explains why margins held in 2025 and buckled in 2026.
Concentration remains high. The top five oriented producers hold 67% of output, and the top five non-oriented producers hold over 66%. Still, tonnage share does not equal grade capability, and small mills cannot reach Hi-B quality without certification work.
Demand anchors support the build-out. Grid investment reached RMB 204 billion in January–May 2025, up 20%, and the cycle should run to 2030. Appliance output grew steadily, and data centre plus storage investment rose over 30%.
One project deserves separate mention. The downstream Yarlung Tsangpo hydropower scheme carries RMB 1.2 trillion of investment and capacity near three Three Gorges equivalents. Its steel demand covers 60,000–70,000 tons of high-grade non-oriented for stators, 56,000–70,000 tons of oriented sheet for ±800 kV lines, and 250–300 tons of ultra-thin grade for reactors.
Buyer Playbook
- Buy grade capability, not catalogue capacity.
- Verify core loss at your operating flux.
- Confirm coating before impregnation planning.
- Time orders around grid tender cycles.
- Keep lot traceability for batch drift.
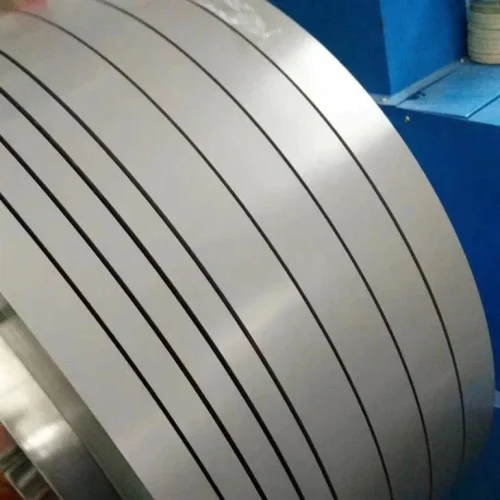
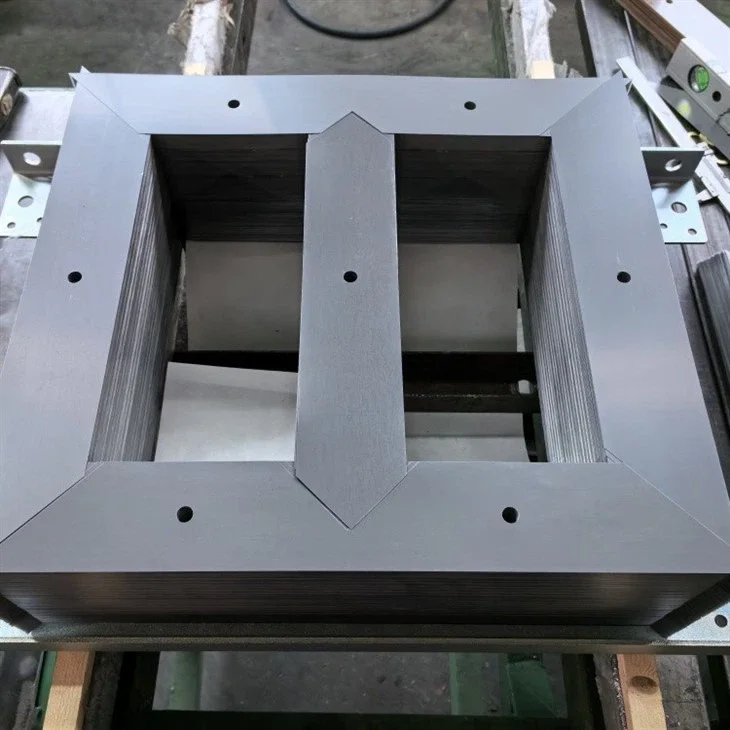
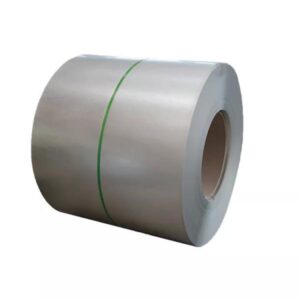
For power transformer cores, M3 Grain Oriented Electrical Steel covers 0.23 mm Hi-B. Distribution units generally take M5 Grain Oriented Electrical Steel at 0.30 mm. Motor builders rely on M19 Non Oriented Electrical Steel across 0.35–0.50 mm.
Frequently Asked Questions
Mixed. Hi-B producers held margin; commodity producers ran near break-even.
Total demand grew faster than substitution. The reversal came in 2026.
No. It moved from volume to grade, concentrating in commodity tiers.
Hi-B quality tiers and anything below 0.20 mm.
MTC EN 10204 3.1, core loss per ASTM A343 or IEC 60404-2, plus coating data.
What We Do Not Do
- We do not roll, anneal, or coat steel.
- We do not stamp laminations or wind cores.
- We do not supply amorphous ribbon.
Consequently, we source and slit coil, then document it honestly.
Specify Your Order
- State the equipment and efficiency class.
- Name the grade and gauge.
- Give slit width and coil ID.
- Confirm tonnage and port.
We reply with stock, price, and lead time within one working day.
- Email: vera.liang@ztwysteel.com
- Location: Xishan District, Wuxi, Jiangsu, China
- Supply range: CRGO M3/M4/M5 at 0.23–0.35 mm, CRNGO M19–M43 at 0.35–0.50 mm
- Slitting tolerance: ±0.05 mm
- Documentation: MTC EN 10204 3.1, core loss per ASTM A343 / IEC 60404-2, coating data






 English